A Wet Runway, a Fast Approach, and a Vanishing Margin
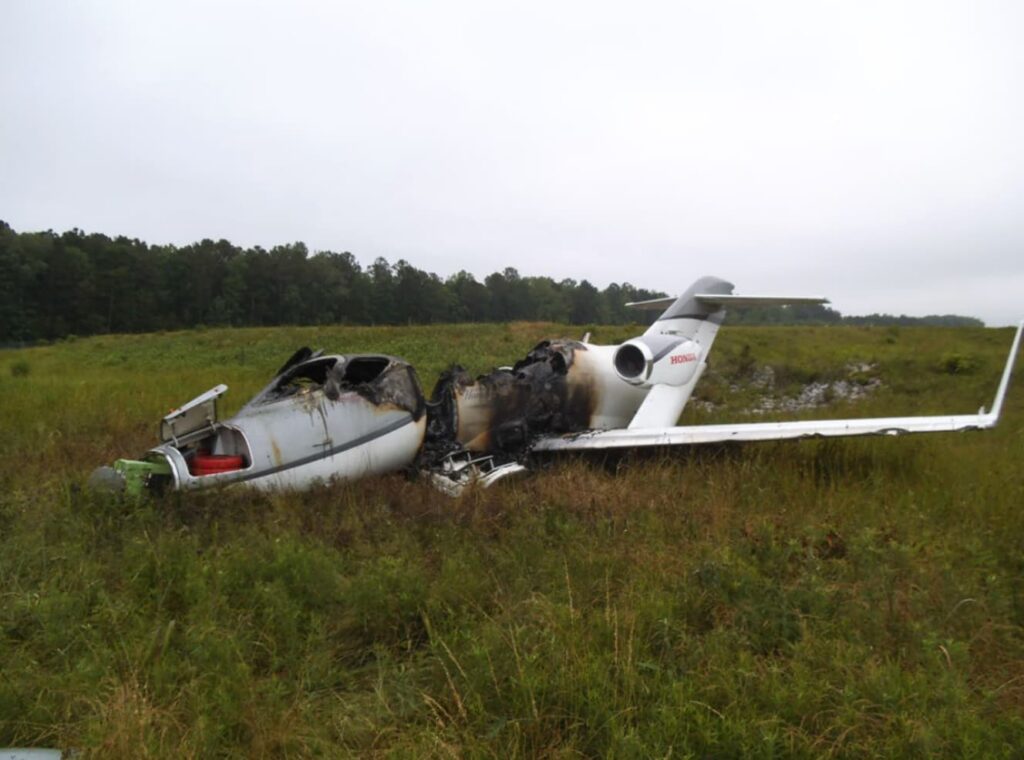
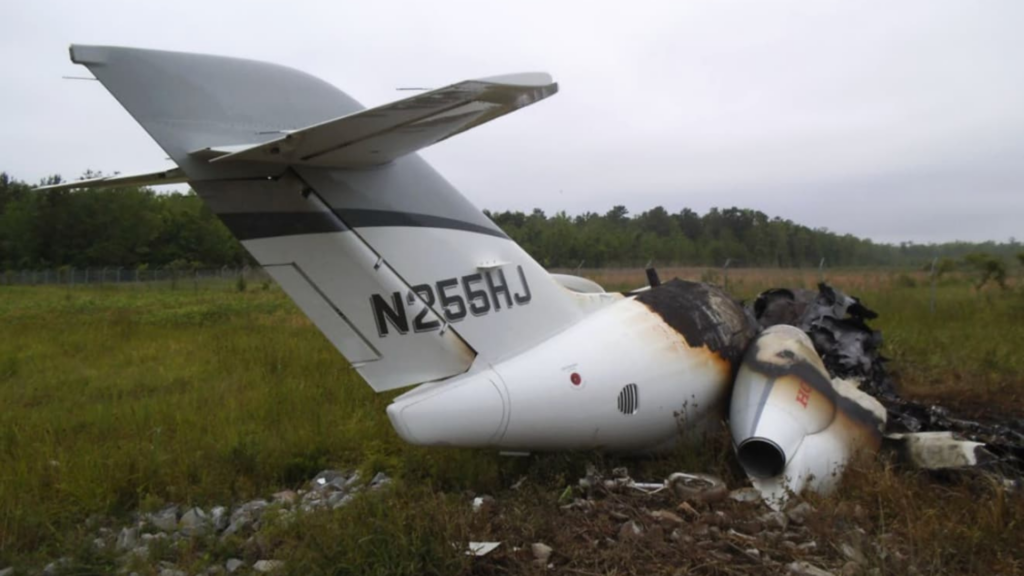
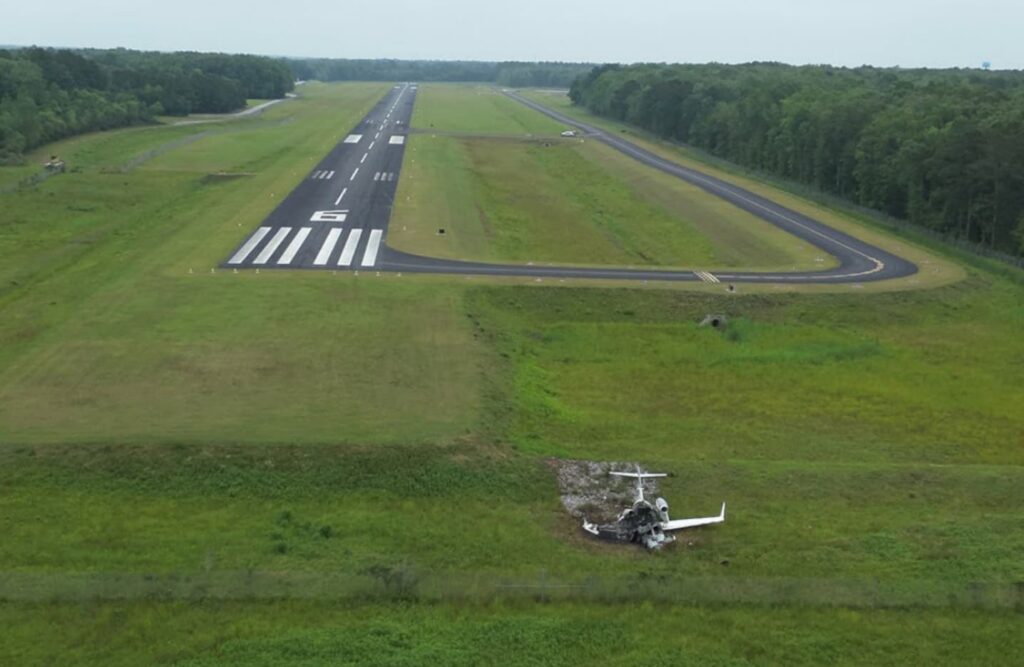
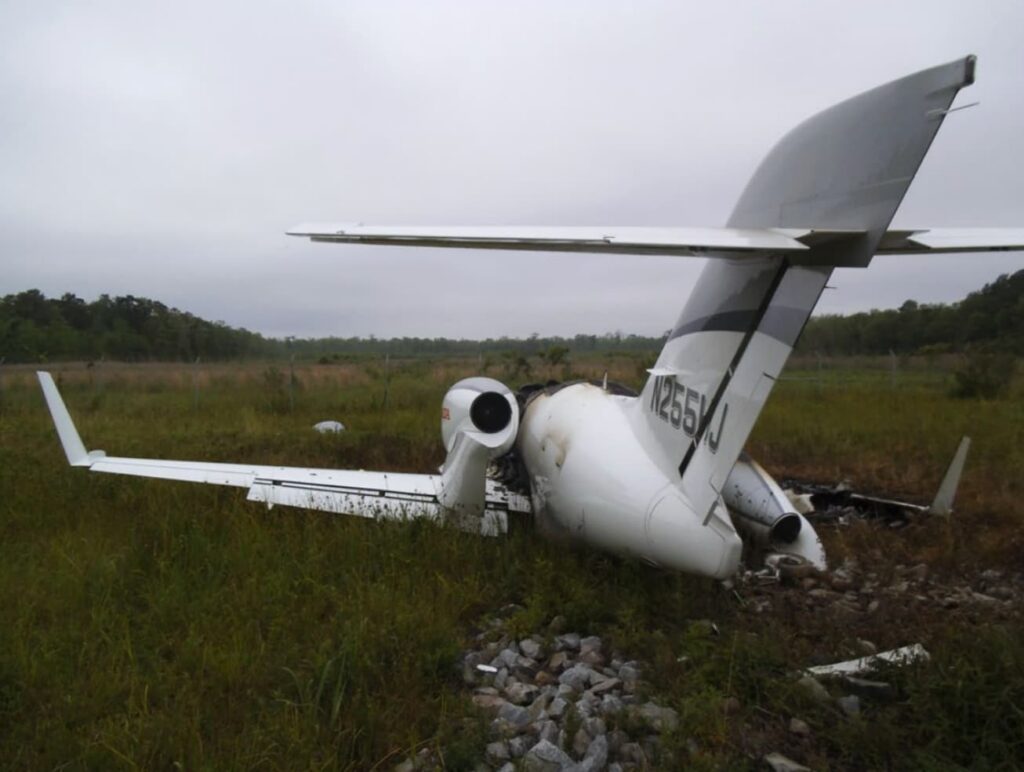
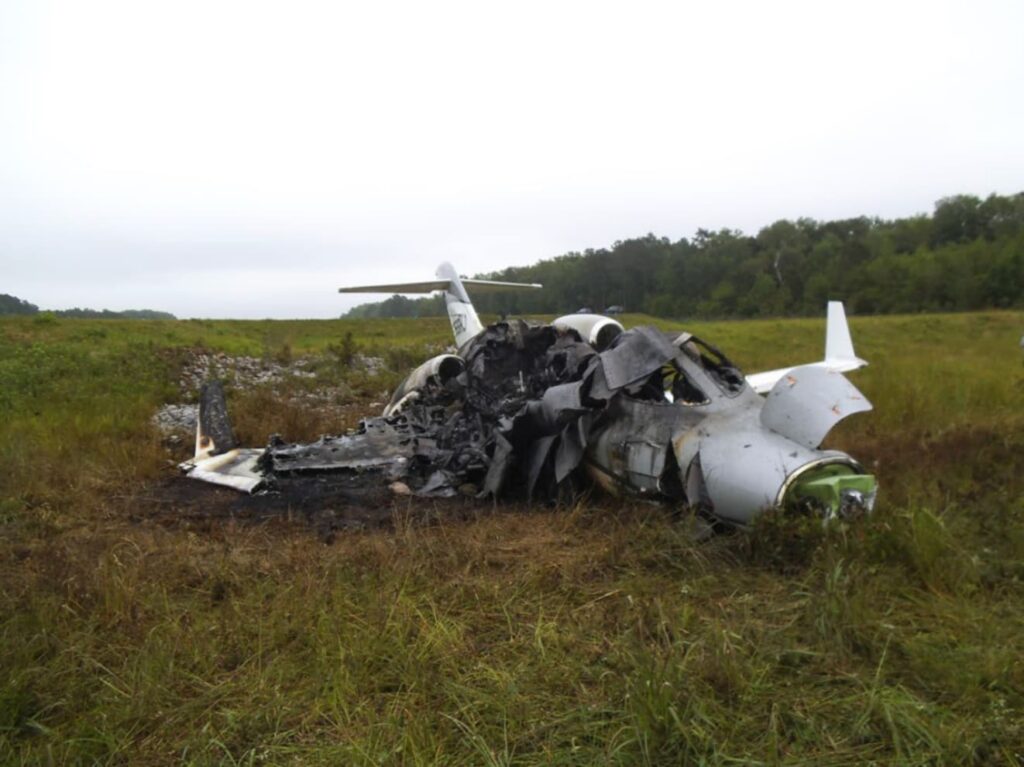
Just after midnight on May 18, 2023, a HondaJet HA-420, registration N255HJ, slid off the end of Runway 24 at Summerville Airport in South Carolina. The airplane traveled down an embankment and came to rest on a rocky berm roughly 360 feet beyond the departure end. A post-impact fire consumed much of the cockpit, center fuselage, and right wing. Remarkably, the commercial pilot and his five passengers exited without injury.
This was a Part 91 personal flight returning from a NASCAR race in North Wilkesboro, North Carolina. What should have been a routine arrival into a familiar airport instead became a case study in how small performance miscalculations can erase safety margins faster than most pilots realize.
The Pilot and the Airplane
The 49-year-old pilot held a commercial certificate with single- and multi-engine land ratings, along with an instrument rating. He had accumulated approximately 1,938 total flight hours, including about 233 hours in the HondaJet HA-420. He had completed recurrent training in the aircraft at FlightSafety International just five months before the accident.
By experience and qualification, this was a proficient pilot. He had flown into Summerville “hundreds” of times and had landed on its 5,000-foot runway in both dry and wet conditions without prior incident. Familiarity with the airplane and the airport likely contributed to a sense of confidence that night.
The HondaJet was equipped with a Garmin G3000 integrated flight deck and a control display unit capable of calculating landing performance data. The aircraft was not required to carry a cockpit voice recorder or flight data recorder, and none was installed. As a result, investigators relied heavily on ADS-B data and physical evidence to reconstruct the sequence of events.
The Setup for the Approach
The flight departed North Wilkesboro at 2329 on an IFR flight plan. The pilot had intentionally delayed departure to allow rainstorms to pass through the Summerville area, knowing the runway would likely still be wet upon arrival.
Weather at 0015 local time included calm winds, 6 miles visibility in mist, a few clouds at 200 feet AGL, and a broken layer at 3,200 feet. It was night visual meteorological conditions. Runway 24 at DYB measured 5,000 feet long and 75 feet wide. The asphalt surface was in excellent condition but ungrooved and slightly downhill.
The pilot flew the RNAV approach coupled to the autopilot until about 600 feet above ground level before hand-flying the remainder. He later stated that he used the aircraft’s control display unit to calculate landing performance, and that the CDU produced a Vref between 119 and 120 knots while indicating that the runway length was sufficient.
He flew the final approach at 120 knots with full flaps and reported touching down before the 1,000-foot markers. ADS-B data captured the aircraft about 200 feet above the runway at 120 knots groundspeed, consistent with his statement.
On the surface, this looked like a stabilized approach. But when the numbers were examined more closely, the margin began to disappear.
When the Math Doesn’t Work
Investigators later entered the same landing conditions into an exemplar HondaJet CDU using zero wind, wet runway, 5,000-foot length, slight slope, flaps landing, and ice protection off. Under those conditions, the calculated Vref was 112 knots, not 120.
That eight-knot difference is significant. Landing performance is highly sensitive to speed, and FAA guidance notes that a 10 percent increase in approach speed can result in approximately a 20 percent increase in landing distance.
At the proper Vref of 112 knots, the exemplar CDU calculated a required landing distance of 4,829 feet on a wet runway. That left only a narrow margin on a 5,000-foot runway. When investigators simulated higher speeds by adding Vref increments, the numbers quickly exceeded the available runway. At Vref plus 5 knots, the required distance grew to 5,311 feet. At Vref plus 10 knots, it expanded to 5,794 feet.
Each time those higher speeds were entered, the CDU displayed a prominent warning: “LANDING FIELD LENGTH INSUFFICIENT.”
Investigators could not determine how the pilot obtained a Vref of 120 knots using the CDU under the actual conditions. The system did not allow arbitrary entry of Vref speeds; it calculated them based on weight and environmental inputs. Nevertheless, the aircraft was flown at 120 knots, and that speed materially affected the stopping distance.
Compounding the issue, Honda had issued a service bulletin in July 2022 that provided updated wet and contaminated runway performance data through a supplemental database. Compliance with the bulletin was not mandatory for Part 91 operators, and the accident aircraft had not incorporated the update. Using the supplemental data, the required landing distance under the accident conditions was approximately 6,100 feet on a wet runway, well beyond the available 5,000 feet.
The Landing Roll and Excursion
After touchdown, the pilot reported immediately applying full brake pressure. The anti-skid system began cycling, but he described the cycling as feeling slower than normal. About halfway down the runway, he realized he would not make his usual taxiway turnoff, but he was not yet concerned because he believed sufficient runway remained.
As the airplane continued down the runway, the left brake suddenly “grabbed,” yawing the aircraft to the left and initiating a sequence of left and right skids. The pilot used rudder inputs to maintain directional control and managed to straighten the airplane before it departed the end of the paved surface.
The jet then traveled down the embankment and came to rest on a rocky berm, where a post-impact fire ignited. Despite substantial damage to the cockpit and center fuselage, all six occupants exited safely.
Postaccident examination of the braking system revealed no preimpact mechanical failures that would have prevented normal operation. Although an initial test revealed an anomaly involving hysteresis in the anti-skid valve, subsequent testing by the manufacturer did not reproduce the issue, and there was no conclusive evidence of a braking system failure.
In the end, the physical evidence pointed back to performance planning rather than mechanical malfunction.
The Probable Cause and the Bigger Picture
The NTSB determined that the probable cause of the accident was the pilot’s improper calculation of landing approach speed and required landing distance, which resulted in a fast touchdown with inadequate runway available and a subsequent runway excursion.
This accident underscores how quickly margins shrink when speed increases, especially on wet runways. An eight-knot difference in approach speed may seem minor in cruise flight, but during landing it can mean the difference between stopping comfortably and running out of pavement.
It also highlights the role of familiarity. The pilot had successfully landed at Summerville many times before. Past experience can create a powerful expectation that the airplane will perform as it always has. When that expectation goes unchallenged, especially in marginal performance scenarios, it can mask the underlying risk.
Performance calculations are not just procedural formalities. They are safety barriers designed to protect against exactly this scenario. When the numbers are tight, they demand attention. When the system presents a warning, it deserves respect.
On that night in Summerville, everyone walked away. But the runway did not get any longer, and the laws of physics did not bend. Five thousand feet can disappear quickly when speed creeps up and conditions deteriorate.